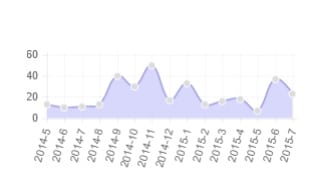
这篇英文博文 https://helloacm.com/archives-of-pagesposts/ 介绍了如何显示历史发表的文章记录 我们接下来要做一个简单的图 用于显示每个月发表的文章数目 (如下). 文章存档 DEMO 在此.

chart-posts-per-months-wordpress-php-js
也许这并没有什么卵用 但是我们大概可以看出一年内哪个月比较心情好 哪个月比较忙等等.
我们需要一个第三方的 JAVASCRIPT 库 用于在浏览器里画图 可以在 https://justyy.com/js/chart.js 下载. 在模板文件里最前面加入以下PHP代码即可.
1 2 3 4 5 6 7 8 9 10 11 12 13 14 15 16 17 18 19 20 21 22 23 24 25 26 27 28 29 30 31 32 33 34 35 36 37 38 39 40 41 42 43 44 45 46 47 48 49 50 51 52 53 54 55 56 57 58 59 60 61 62 63 64 65 66 67 68 | echo '<script language="Javascript" src="https://justyy.com/js/chart.js"></script>'."\n"; global $wpdb; // helloacm.com // count the posts number group by each month $query = " select concat(year(`post_date`), '-', month(`post_date`)) as `month`, count(1) as `cnt` from `wp_posts` where (post_type='page' or post_type='post') and `post_status` = 'publish' group by `month` order by `post_date` desc limit 12 "; // 默认统计 过去 12个月 $result = array_reverse($wpdb->get_results($query));// 默认按时间顺序从左往右显示 if ($result) { ?> <div id='ReportBarChartContainerMonthly'> <div id='ReportBarChartComponentMonthly' style='margin: 15px;'> <canvas id="myChartMonthly" style='max-width:100%;height:auto'></canvas> </div> </div> <script language="Javascript"> var data = { labels: [ <?php foreach ($result as $month) { echo '"'.$month->month.'", '; } ?> ], datasets: [ { label: "Number of Posts", fillColor: "rgba(200,200,250,0.7)", strokeColor: "rgba(150,150,220,1)", pointColor: "rgba(220,220,220,1)", pointStrokeColor: "#fff", pointHighlightFill: "#fff", pointHighlightStroke: "rgba(220,220,220,1)", data: [ <?php foreach ($result as $month) { echo '"'.$month->cnt.'", '; } ?> ] } ] }; var ctx = document.getElementById("myChartMonthly").getContext("2d"); var myNewChart = new Chart(ctx).Line(data, { bezierCurve: true }); </script> < ?php } |
  echo '<script language="Javascript" src="https://justyy.com/js/chart.js"></script>'."\n";
  global $wpdb; // helloacm.com

  // count the posts number group by each month
  $query = "
      select
        concat(year(`post_date`), '-', month(`post_date`)) as `month`,
        count(1) as `cnt`
      from
        `wp_posts`
      where
        (post_type='page' or post_type='post') and
        `post_status` = 'publish'
      group by
        `month`
      order by
        `post_date` desc
      limit
         12
";  // 默认统计 过去 12个月

  $result = array_reverse($wpdb->get_results($query));// 默认按时间顺序从左往右显示
  if ($result) {
?>

<div id='ReportBarChartContainerMonthly'>
    <div id='ReportBarChartComponentMonthly' style='margin: 15px;'>
        <canvas id="myChartMonthly" style='max-width:100%;height:auto'></canvas>
    </div>
</div>

<script language="Javascript">
    var data = {
        labels: [

            <?php
    foreach ($result as $month) {
      echo '"'.$month->month.'", ';
    }
            ?>
        ],
        datasets: [
            {
                label: "Number of Posts",
                fillColor: "rgba(200,200,250,0.7)",
                strokeColor: "rgba(150,150,220,1)",
                pointColor: "rgba(220,220,220,1)",
                pointStrokeColor: "#fff",
                pointHighlightFill: "#fff",
                pointHighlightStroke: "rgba(220,220,220,1)",
                data: [
            <?php
    foreach ($result as $month) {
      echo '"'.$month->cnt.'", ';
    }
            ?>
                ]
            }
        ]
    };

    var ctx = document.getElementById("myChartMonthly").getContext("2d");
    var myNewChart = new Chart(ctx).Line(data, {
        bezierCurve: true
    });
</script>
< ?php
}保存 并且 删除缓存 就可以显示出来了
需要注意的是: (1) SQL语句最后面 那个 LIMIT 12 就是统计月份数目 默认过去12个月 (2) array_reverse 是把结果从左往右按时间顺序 去除这个调用 就变成从右往左 (3) 如果WP的表不是以wp_开头则需要修改.
英文: https://helloacm.com/how-to-show-chart-statistics-of-monthly-number-of-posts-in-wordpress/
GD Star Rating
loading...
本文一共 261 个汉字, 你数一下对不对.loading...
上一篇: 入手 Corsair 海盗 机械键盘
下一篇: 软件公司 老板开的车
扫描二维码,分享本文到微信朋友圈


啥时候换主题了?
主题没有换..